Closing the loop
Summer has a way of getting away from you. That is as much relevant for blog writing as it is for life. Nonetheless, before summer ends we wanted to dust off our series on regime prediction and close the loop on the remaining techniques we had yet to investigate. That is, in our last post we initiated a relatively simple rolling method to retrain the model on more near term (and perhaps more relevant) data.
The results using hierarchical clustering were pretty dramatic – generating a 281% cumulative return vs. -10% for the underlying. How will that look for Gaussian Mixture Models (GMMs) or Hidden Markov Models (HMMs)? Spoiler alert: abysmal. We used the same parameters as for the clustering model: a 252-day window and a retrain trigger every 20 days.
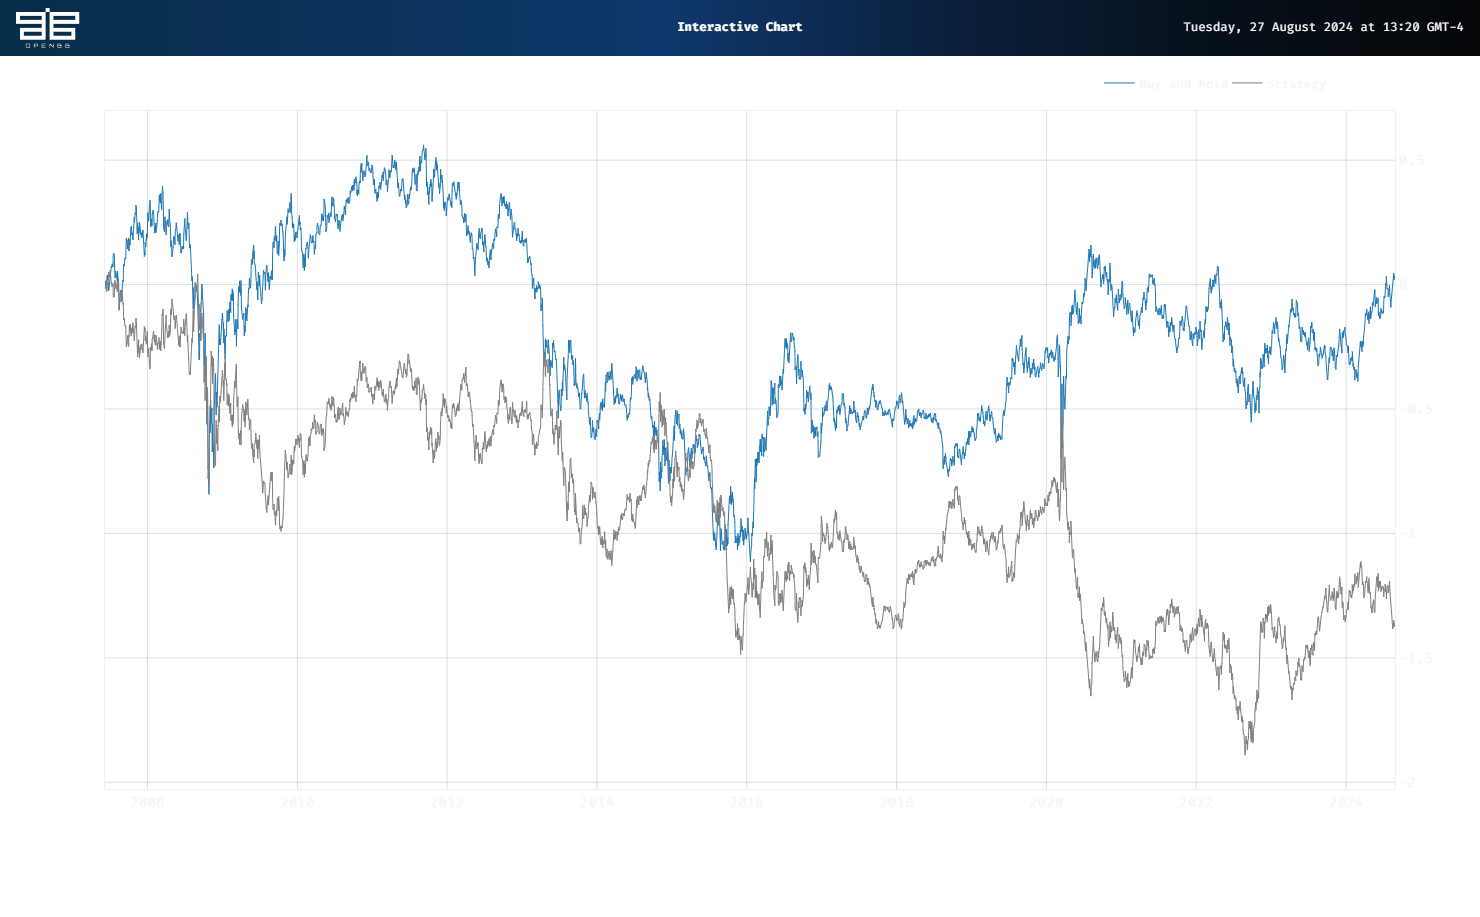
For the GMM, the strategy would have bankrupted its user! As shown in the graph below, this is one to avoid.
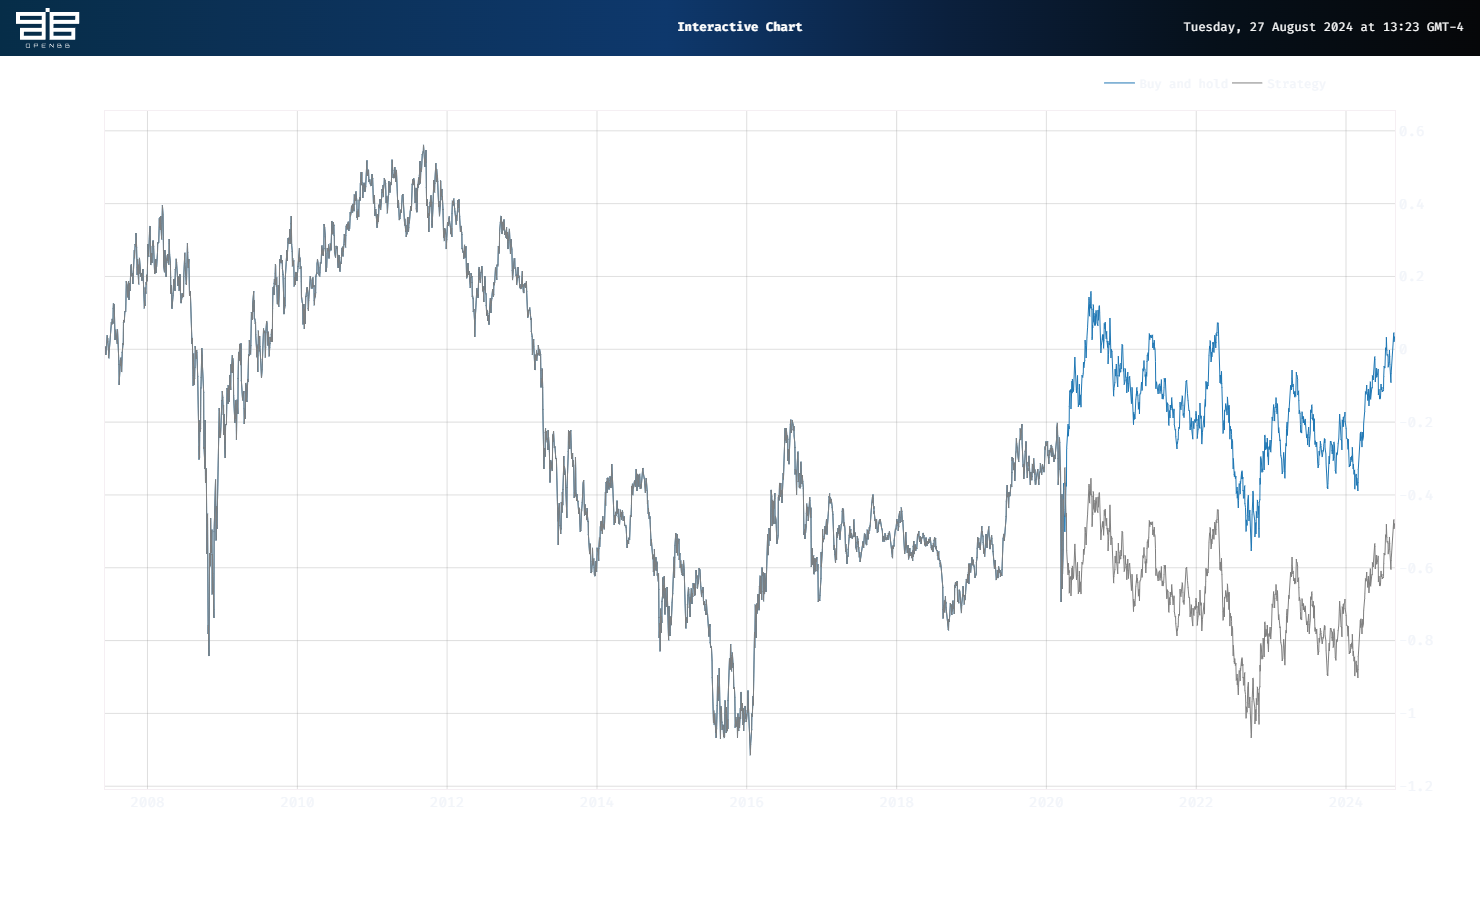
Applying the same parameters to an HMM wouldn’t have fared much better. Strangely, the strategy perfectly mirrors the underlying until it diverges in 2020, underperforming for the remainder of the period.
What’s a quant researcher to do with these results? Quietly file them away in a useful nonstarter pile and hope you never have to show them to anyone else.
While HMMs and GMMs haven’t exactly been a resounding success when more realistic lookback periods were applied, that doesn’t mean we can’t use them with more intelligent features (we were only using log returns) and in combination with other tools. For example, an ensemble approach might produce better results. Alternatively, our choice of underlying might not have showcased these models, the way clustering did. A quick scan of the Buy and Hold graph shows the ETF has pretty much returned almost nothing with a lot of volatility stirred in. Is whipsaw a market regime?
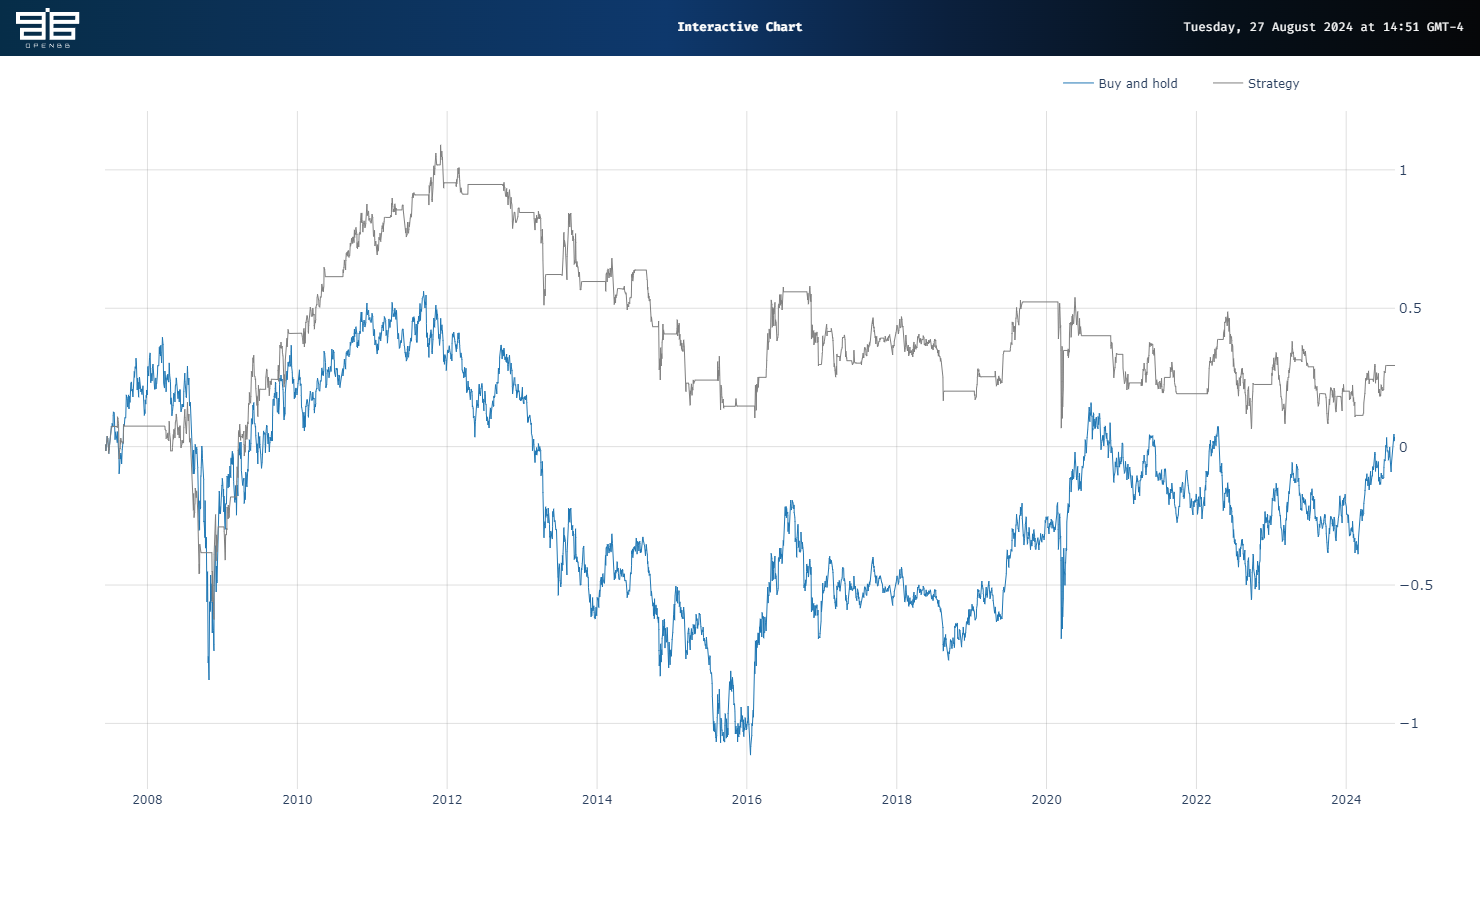
Maybe two states aren’t really sufficient to find the hidden structure. Adding a third state, but only using the last one as the buy signal produces a salutary effect on performance compared with the prior results, as shown in the graph below. But it’s probably not going to replace your FIRE strategy.
Whatever the case, there’s definitely more to examine when it comes to forecasting market regimes. Time to roll up the sleeves. Stay tuned.
Here’s the code.
# Built using Python 3.10.19 and a virtual environment

# Install packages
from openbb import obb
import numpy as np
import pandas as pd
from hmmlearn.hmm import GaussianHMM
from sklearn.cluster import AgglomerativeClustering
from sklearn.mixture import GaussianMixture
import math
import warnings
warnings.filterwarnings('ignore')
import yfinance as yf
import matplotlib.pyplot as plt

# Functions
def prepare_data_for_model_input(prices: pd.DataFrame, ma: int, instrument: str) -> pd.DataFrame | np.ndarray:
    """
    Returns a dataframe with prices, moving average, and log returns as well as np.array of log returns
    """
    prices[f'{instrument}_ma'] = prices[instrument].rolling(ma).mean()
    prices[f'{instrument}_log_return'] = np.log(prices[f'{instrument}_ma']/prices[f'{instrument}_ma'].shift(1)).dropna()

    prices = prices.dropna()
    prices_array = prices[f'{instrument}_log_return'].values.reshape(-1,1)

    return prices, prices_array

class RegimeDetection:

    """
    Object to hold clustering, Gaussian Mixture or Hidden Markov Models
    """
    def get_regimes_hmm(self, input_data, params):
        hmm_model = self.initialise_model(GaussianHMM(), params).fit(input_data)
        return hmm_model

    def get_regimes_clustering(self, params):
        clustering =  self.initialise_model(AgglomerativeClustering(), params)
        return clustering

    def get_regimes_gmm(self, input_data, params):
        gmm = self.initialise_model(GaussianMixture(), params).fit(input_data)
        return gmm

    def initialise_model(self, model, params):
        for parameter, value in params.items():
            setattr(model, parameter, value)
        return model

def feed_forward_training(model: RegimeDetection, params: dict, prices: np.array, split_index: int, retrain_step: int, cluster: bool = False, roll: bool = False) -> list:
    """
    Returns list of regime states
    """

    # train/test split and initial model training
    init_train_data = prices[:split_index]
    test_data = prices[split_index:]
    if cluster:
        rd_model = model(params)
    else:
        rd_model = model(init_train_data, params)

    # predict the state of the next observation
    states_pred = []
    for i in range(math.ceil(len(test_data))):
        start_index = i if roll else 0

        split_index += 1
        if cluster:
            preds = rd_model.fit_predict(prices[start_index:split_index]).tolist()
        else:
            preds = rd_model.predict(prices[start_index:split_index]).tolist()
        states_pred.append(preds[-1])

        # retrain the existing model
        if i % retrain_step == 0:
            if cluster:
                pass
            else:
                rd_model = model(prices[start_index:split_index], params)

    return  states_pred

def get_strategy_df(prices_df: pd.DataFrame, split_idx: int, state_array: list, data_col: str, shift: int = 1, short: bool = False) -> pd.DataFrame:
    """
    Returns dataframe of prices and returns to buy and hold and strategy
    """

    prices_with_states = pd.DataFrame(prices_df[split_idx:][data_col])
    prices_with_states['state'] = state_array
    prices_with_states['ret'] = np.log(prices_df[data_col] / prices_df[data_col].shift(1)).dropna()
    prices_with_states['state'] = prices_with_states['state'].shift(shift)
    prices_with_states.dropna(inplace = True)
    if short:
        prices_with_states['position'] = np.where(prices_with_states['state'] == 1, 1, -1)
    else:
        prices_with_states['position'] = np.where(prices_with_states['state'] == 1,1,0)
    prices_with_states['strat_ret'] = prices_with_states['position'] * prices_with_states['ret']
    prices_with_states['Buy and hold'] = prices_with_states['ret'].cumsum()
    prices_with_states['Strategy'] = prices_with_states['strat_ret'].cumsum()

    return prices_with_states

# Get data
symbol = "GDX"
data = obb.equity.price.historical(
    symbol=symbol,
    start_date="1999-01-01",
    provider="yfinance")
prices = pd.DataFrame(data.to_df()['close'])

prices, prices_array = prepare_data_for_model_input(prices, 10, 'close')

# If you want to graph the prices
# line_chart = data.charting.create_line_chart
# line_chart(
#     data=prices,
#     x=prices.index,
#     y="close",
#     title="GDX",
# )

# Create GMM Regime and Backtest
regime_detection = RegimeDetection()
model =  regime_detection.get_regimes_gmm
param_dict = {'gmm': {'n_components':2, 'covariance_type':"full", 'random_state':100, 'max_iter': 100000, 'n_init': 30,'init_params': 'kmeans', 'random_state':100},
              'clustering': {'n_clusters': 2, 'linkage': 'complete',  'affinity': 'manhattan', 'metric': 'manhattan', 'random_state':100},
              'hmm': {'n_components':2, 'covariance_type': 'full', 'random_state':100}
}
params = param_dict['gmm']
roll_index = 252

# Generate regime
roll_states = feed_forward_training(model, params, prices_array, roll_index, 20, cluster=True, roll=True)

# Add to price dataframe
prices['roll_regime'] = np.nan
roll_idx = prices.columns.to_list().index('roll_regime')
prices.iloc[roll_index:, roll_idx] = np.array(roll_states)
prices['roll_regime_0'] = np.where(prices.roll_regime == 0, prices.close, np.nan)
prices['roll_regime_1'] = np.where(prices.roll_regime == 1, prices.close, np.nan)

# Get Performance
prices_with_states_roll = get_strategy_df(prices, roll_index, roll_states, 'close', short=True)

# Graph result
line_chart = data.charting.create_line_chart
line_chart(
    data=prices_with_states_roll,
    x=prices_with_states_roll.index,
    y=['Buy and hold', 'Strategy']
)

# Create HMM Regime and Backtest
regime_detection = RegimeDetection()
model =  regime_detection.get_regimes_hmm
param_dict = {'gmm': {'n_components':2, 'covariance_type':"full", 'random_state':100, 'max_iter': 100000, 'n_init': 30,'init_params': 'kmeans', 'random_state':100},
              'clustering': {'n_clusters': 2, 'linkage': 'complete',  'affinity': 'manhattan', 'metric': 'manhattan', 'random_state':100},
              'hmm': {'n_components':2, 'covariance_type': 'full', 'random_state':100}
}
params = param_dict['hmm']
roll_index = 252

# Generate regime
roll_states = feed_forward_training(model, params, prices_array, roll_index, 20, cluster=True, roll=True)

# Add to price dataframe
prices['roll_regime'] = np.nan
roll_idx = prices.columns.to_list().index('roll_regime')
prices.iloc[roll_index:, roll_idx] = np.array(roll_states)
prices['roll_regime_0'] = np.where(prices.roll_regime == 0, prices.close, np.nan)
prices['roll_regime_1'] = np.where(prices.roll_regime == 1, prices.close, np.nan)

# Get Performance
prices_with_states_roll = get_strategy_df(prices, roll_index, roll_states, 'close', short=True)

# Graph result
line_chart = data.charting.create_line_chart
line_chart(
    data=prices_with_states_roll,
    x=prices_with_states_roll.index,
    y=['Buy and hold', 'Strategy']
)


# Create HMM 3 State Regime and Backtest
regime_detection = RegimeDetection()
model =  regime_detection.get_regimes_hmm
param_dict = {'gmm': {'n_components':2, 'covariance_type':"full", 'random_state':100, 'max_iter': 100000, 'n_init': 30,'init_params': 'kmeans', 'random_state':100},
              'clustering': {'n_clusters': 2, 'linkage': 'complete',  'affinity': 'manhattan', 'metric': 'manhattan', 'random_state':100},
              'hmm': {'n_components':2, 'covariance_type': 'full', 'random_state':100}
}
params = param_dict['hmm']
roll_index = 252

# Generate regime
roll_states = feed_forward_training(model, params, prices_array, roll_index, 20, cluster=True, roll=True)

# Convert to numpy array to allow masking
roll_states = np.array(roll_states)
roll_states[roll_states == 1] = 0
roll_states[roll_states == 2] = 1

# Add to price dataframe
prices['roll_regime'] = np.nan
roll_idx = prices.columns.to_list().index('roll_regime')
prices.iloc[roll_index:, roll_idx] = np.array(roll_states)
prices['roll_regime_0'] = np.where(prices.roll_regime == 0, prices.close, np.nan)
prices['roll_regime_1'] = np.where(prices.roll_regime == 1, prices.close, np.nan)

# Get Performance
prices_with_states_roll = get_strategy_df(prices, roll_index, roll_states, 'close', short=True)

# Graph result
line_chart = data.charting.create_line_chart
line_chart(
    data=prices_with_states_roll,
    x=prices_with_states_roll.index,
    y=['Buy and hold', 'Strategy']
)