Hidden miners
We conclude our discussion of market regime detection by examining Hidden Markov Models (HMMs). Recall this series was inspired by a post from PyQuant News that highlighted a longer article from the London Stock Exchange Group (LSEG).
Those who took the CFA exams probably forgot using HMMs in the quant section. Whatever the case, the intuition behind them is clever. HMMs use observable data to infer non-observable data, or hidden states. Think of it like using using the emoji count in your partner’s text message to infer your partner’s mood. In investing, this would be like trying to predict the market regime (up/down) based on observable data like returns, volume, social influence tweets, etc.
The way such a model is built is the following. Start with some initial probability of the states one wants to predict. Calculate probabilities of the observation based on the state (aka emission probability). Estimate the probabilities that one state follows the next (e.g., after five positive return days, the market declines the next 45% of the time – aka transition probability). Iterate the process to improve accuracy of the probabilities.
Okay, so we’ve got a very rough idea of how HMMs are built. The key goal is to see if an HMM’s predictions will result in a solid proof-of-concept backtest. Spoiler alert! For GDX, the answer is no.
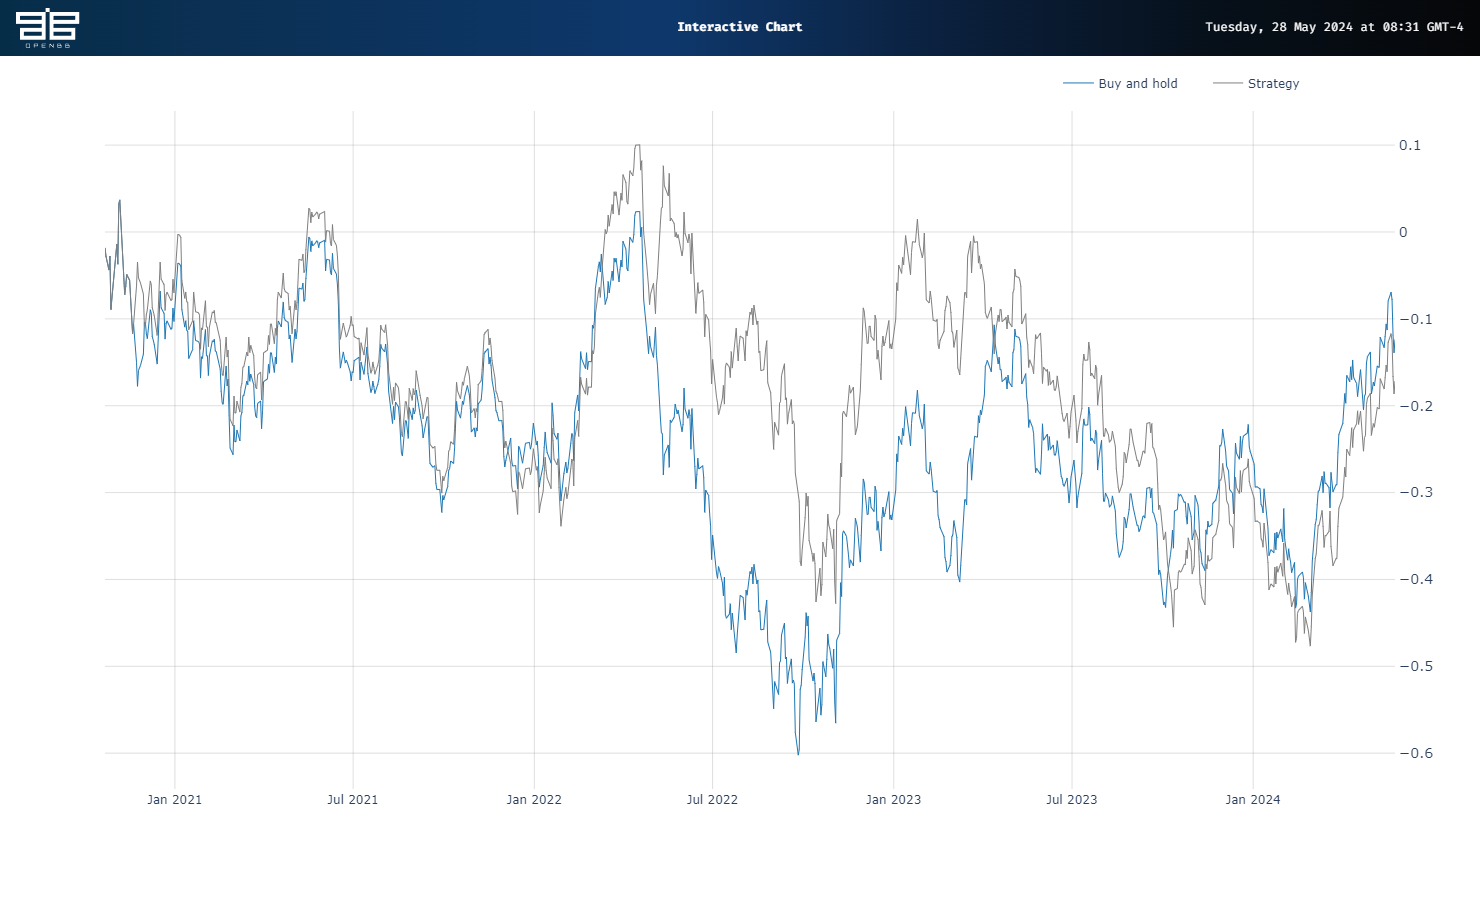
When we train a model using the same parameters as in our prior posts – 20-day lookback on log returns using 80% of the data set starting in 2006 – the HMM signals yield a modest cumulative underperformance of 5 percentage points. And as you can see in the graph below, the Strategy pretty much mirrors Buy and hold.
Now, we did not perform any cross-validation or hyperparameter tuning for this. But we also didn’t do that for the clustering or Gaussian Mixture Models (GMMs). Based on our past three posts, it looks like GMMs perform the best in predicting market regimes, generating signals that yield positive risk-adjusted returns for GDX. Will they do so for other ETFs or stocks? Who knows. Will they do that two-years from now? Who knows. Our next post will examine employing walk-forward analysis to regime prediction to approximate a more likely prediction cadence.
Here’s the code.
# Built using Python 3.10.19 and a virtual environment

# Install packages
from openbb import obb
import numpy as np
import pandas as pd
from hmmlearn.hmm import GaussianHMM
from sklearn.cluster import AgglomerativeClustering
from sklearn.mixture import GaussianMixture
import math
import warnings
warnings.filterwarnings('ignore')
import yfinance as yf
import matplotlib.pyplot as plt

# Functions
def prepare_data_for_model_input(prices: pd.DataFrame, ma: int, instrument: str) -> pd.DataFrame | np.ndarray:
    """
    Returns a dataframe with prices, moving average, and log returns as well as np.array of log returns
    """
    prices[f'{instrument}_ma'] = prices[instrument].rolling(ma).mean()
    prices[f'{instrument}_log_return'] = np.log(prices[f'{instrument}_ma']/prices[f'{instrument}_ma'].shift(1)).dropna()

    prices = prices.dropna()
    prices_array = prices[f'{instrument}_log_return'].values.reshape(-1,1)

    return prices, prices_array

class RegimeDetection:

    """
    Object to hold clustering, Gaussian Mixture or Hidden Markov Models
    """
    def get_regimes_hmm(self, input_data, params):
        hmm_model = self.initialise_model(GaussianHMM(), params).fit(input_data)
        return hmm_model

    def get_regimes_clustering(self, params):
        clustering =  self.initialise_model(AgglomerativeClustering(), params)
        return clustering

    def get_regimes_gmm(self, input_data, params):
        gmm = self.initialise_model(GaussianMixture(), params).fit(input_data)
        return gmm

    def initialise_model(self, model, params):
        for parameter, value in params.items():
            setattr(model, parameter, value)
        return model

def feed_forward_training(model: RegimeDetection, params: dict, prices: np.array, split_index: int, retrain_step: int, cluster: bool =False) -> list:
    """
    Returns list of regime states
    """

    # train/test split and initial model training
    init_train_data = prices[:split_index]
    test_data = prices[split_index:]
    if cluster:
        rd_model = model(params)
    else:
        rd_model = model(init_train_data, params)

    # predict the state of the next observation
    states_pred = []
    for i in range(math.ceil(len(test_data))):
        split_index += 1
        if cluster:
            preds = rd_model.fit_predict(prices[:split_index]).tolist()
        else:
            preds = rd_model.predict(prices[:split_index]).tolist()
        states_pred.append(preds[-1])

        # retrain the existing model
        if i % retrain_step == 0:
            if cluster:
                pass
            else:
                rd_model = model(prices[:split_index], params)

    return  states_pred

def get_strategy_df(prices_df: pd.DataFrame, split_idx: int, state_array: list, data_col: str, shift: int = 1, short: bool = False) -> pd.DataFrame:
    """
    Returns dataframe of prices and returns to buy and hold and strategy
    """

    prices_with_states = pd.DataFrame(prices_df[split_idx:][data_col])
    prices_with_states['state'] = state_array
    prices_with_states['ret'] = np.log(prices_df[data_col] / prices_df[data_col].shift(1)).dropna()
    prices_with_states['state'] = prices_with_states['state'].shift(shift)
    prices_with_states.dropna(inplace = True)
    if short:
        prices_with_states['position'] = np.where(prices_with_states['state'] == 1, 1, -1)
    else:
        prices_with_states['position'] = np.where(prices_with_states['state'] == 1,1,0)
    prices_with_states['daily_hmm'] = prices_with_states['position'] * prices_with_states['ret']
    prices_with_states['Buy and hold'] = prices_with_states['ret'].cumsum()
    prices_with_states['Strategy'] = prices_with_states['daily_hmm'].cumsum()

    return prices_with_states

# Get data
symbol = "GDX"
data = obb.equity.price.historical(
    symbol=symbol,
    start_date="1999-01-01",
    provider="yfinance")
prices = pd.DataFrame(data.to_df()['close'])

prices, prices_array = prepare_data_for_model_input(prices, 10, 'close')

# If you want to graph the prices
# line_chart = data.charting.create_line_chart
# line_chart(
#     data=prices,
#     x=prices.index,
#     y="close",
#     title="GDX",
# )

# Create Regime and Backtest
regime_detection = RegimeDetection()
model =  regime_detection.get_regimes_Hmm
param_dict = {'gmm': {'n_components':2, 'covariance_type':"full", 'random_state':100, 'max_iter': 100000, 'n_init': 30,'init_params': 'kmeans', 'random_state':100},
              'clustering': {'n_clusters': 2, 'linkage': 'complete',  'affinity': 'manhattan', 'metric': 'manhattan', 'random_state':100},
              'hmm': {'n_components':2, 'covariance_type': 'full', 'random_state':100}
}
params = param_dict['hmm']
split_index = math.ceil(prices.shape[0] *.8)

# Generate regime
states = feed_forward_training(model, params, prices_array, split_index, 20, cluster=False)

# Add to price dataframe
prices['regime'] = np.nan
reg_idx = prices.columns.to_list().index('regime')
prices.iloc[split_index:, reg_idx] = np.array(states)
prices['regime_0'] = np.where(prices.regime == 0, prices.close, np.nan)
prices['regime_1'] = np.where(prices.regime == 1, prices.close, np.nan)

# Get Performance
prices_with_states = get_strategy_df(prices, split_index, states, 'close', short=True)

# Graph result
line_chart = data.charting.create_line_chart
line_chart(
    data=prices_with_states,
    x=prices_with_states.index,
    y=['Buy and hold', 'Strategy']
)